3 Underused Shopify Reports That Tell You More Than Google Analytics
 By Muhammed Tüfekyapan
You have 14 browser tabs open. GA4. Hotjar. Klaviyo. Maybe a heatmap tool. Yet you still cannot answer a simple question: "How many visits does it take before someone buys from my store?" The answer lives inside underused Shopify reports you probably never check.
Google Analytics tracks traffic. Shopify tracks buying behavior. Most merchants obsess over the first and ignore the second. GA4 tells you where visitors come from. It struggles to tell you what they do with products, carts, and purchase decisions inside your store.
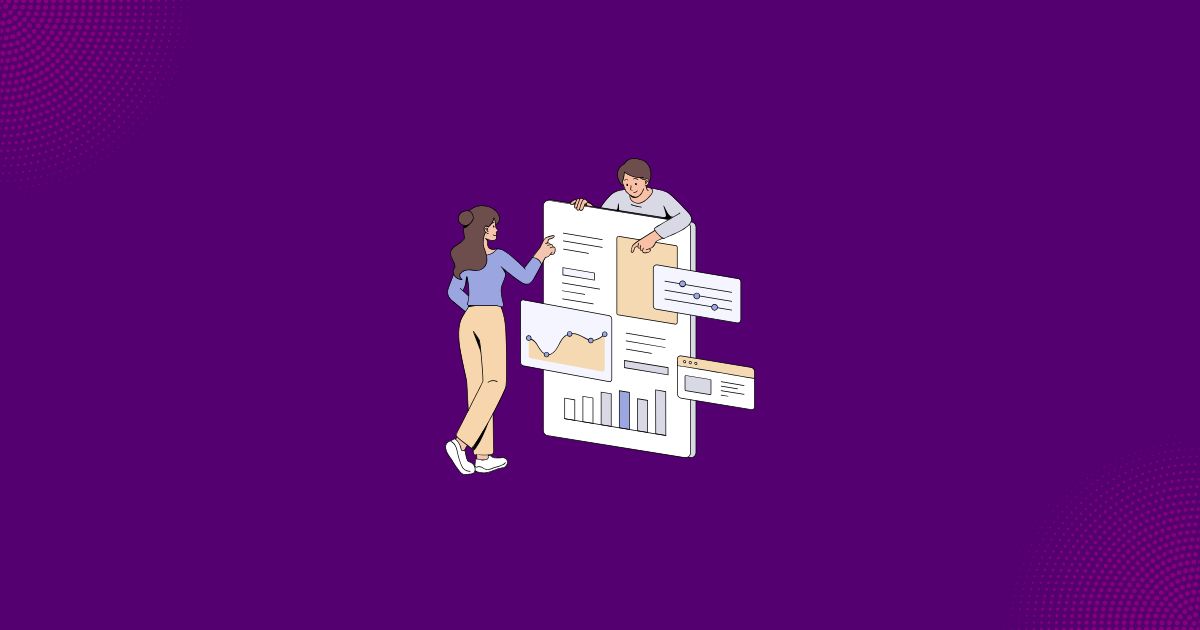
The truth is simple. Shopify has underused Shopify reports that answer questions GA4 simply cannot. Three specific reports sit inside your admin right now. Most merchants never open them.
This article covers each report with a clear breakdown: what it shows, why it matters, and what to do about it. No fluff. Just actionable steps you can take today.
The GA4 Blind Spot Every Shopify Merchant Has
GA4 excels at acquisition data. Traffic sources, sessions, bounce rates, demographics - it handles all of that well. But when it comes to Shopify product reports and product-level behavior, GA4 has known limits.
- Enhanced Ecommerce tracking requires custom setup and often breaks during theme updates
- Cross-device attribution remains imperfect
- GA4's event-based model creates data sampling on high-traffic stores
- Product-level add-to-cart rates need custom event configuration that most merchants skip
Meanwhile, Shopify collects first-party transactional data directly. No scripts. No sampling. No breakage. The data is already there. Merchants just never look at it. Industry surveys show that fewer than 20% of small-to-mid Shopify stores regularly check their Shopify built-in reports beyond the Overview dashboard. Most rely on Shopify analytics vs Google Analytics comparisons that never happen because they only check one tool.
Here are three underused Shopify reports already inside your admin that deserve a weekly visit.
Report 1: Product Segmentation - Find Your "Bottlenecks" Before They Cost You Sales
What It Shows
The product segmentation Shopify report categorizes every product based on traffic and conversion performance. It splits your catalog into three zones: Inactive, Gaining Traction, and Powerhouse. Within those zones, it defines eight specific segments: Invisibles, Stoppers, Gems, Prospects, Underperformers, Stars, Essentials, and Bottlenecks.
Why It Matters
This is one of the most valuable underused Shopify reports, and each segment tells you something different about your products. "Bottlenecks" get high traffic but have below-average add-to-cart rates. These pages attract attention but fail to convert. "Gems" are the opposite - low traffic, above-average add-to-cart rates. They convert well but need more eyeballs. "Stoppers" get views but zero add-to-cart actions. Something is wrong with the page itself.
GA4 can show you pageviews per product. It cannot classify products by conversion performance relative to your store average without heavy custom work. This is one of the most powerful underused Shopify reports because it does that classification for you automatically.
What To Do About It
- Bottlenecks: Review product photos, descriptions, pricing, and reviews. These pages are leaking potential sales. Test changes weekly.
- Gems: Push more traffic to them. Feature them in collections, email campaigns, and homepage sections. They convert - they just need visitors.
- Stoppers: Audit these pages right away. Check for missing images, unclear sizing, poor descriptions, or pricing mismatches.
Quick Check: Open Shopify Admin > Analytics > Product analytics. Look for products in the "Bottleneck" segment. These are your biggest missed opportunities - high traffic, low conversion.
Report 2: Purchase Insights - Know How Long Your Customers Actually Take to Buy
What It Shows
The Shopify purchase insights report reveals three critical numbers: the average time from first visit to purchase, the average number of sessions before buying, and the average number of product pages viewed before a purchase happens.
Why It Matters
Most merchants assume customers buy on the first visit. The data usually tells a different story. If your average customer needs 3 sessions and views 7 products before buying, a single-session pop-up strategy makes little sense. This report reveals your real buying cycle - not the one you assume.
GA4 has multi-touch attribution, but it tracks channel paths, not on-site product browsing journeys. That is a big difference when you are trying to understand Shopify purchase insights at the product level.
What To Do About It
- Time-to-purchase is long (5+ days): Your retargeting and email sequences need to cover that full window. A 3-day retargeting window means you lose people mid-decision.
- Sessions-before-purchase is high (3+): Invest in product comparison pages, detailed FAQ sections, and trust signals. These visitors are researching carefully.
- Product-pages-viewed is high (6+): Your navigation and product recommendations need work. Help visitors find the right product faster.
Real example: A home decor store discovered their average customer visited 4 times over 11 days before purchasing. They extended their email welcome sequence from 3 emails (over 5 days) to 6 emails (over 14 days) and saw a measurable lift in first-purchase conversions.
Report 3: Cart Insights - The Report Google Analytics Gets Wrong
What It Shows
The cart insights report tracks total carts created per day, total products placed in carts, average items per cart, total cart value, and average order value per cart. It gives you a complete picture of what happens between "add to cart" and "checkout."
Why It Matters
GA4 cart data depends on event tracking that frequently undercounts. Ad blockers, consent banners, and script loading failures all create gaps. Shopify cart data is server-side. Every cart creation is recorded regardless of browser extensions or consent settings.
The gap between "carts created" and "orders completed" is your true abandonment picture - and Shopify's numbers are more accurate than what Shopify analytics vs Google Analytics comparisons typically reveal. Average items per cart also shows whether customers are buying singles or building baskets. That is critical for bundling and threshold strategies.
What To Do About It
- Average items per cart is low (close to 1): Your cross-sell and upsell strategy needs attention. Consider product bundles, "frequently bought together" widgets, or free shipping thresholds that encourage adding one more item.
- Total cart value is high but conversion is low: Pricing or checkout friction is the likely issue. Visitors want your products at those quantities - something stops them at the finish line.
- Carts-created trend is declining while traffic holds steady: Your product pages are losing persuasion power. Revisit product copy, images, and social proof.
Pro tip: Compare your Shopify cart data with your GA4 cart data for the same period. If there is a big gap, your GA4 tracking has holes - and you have been making decisions on incomplete information.
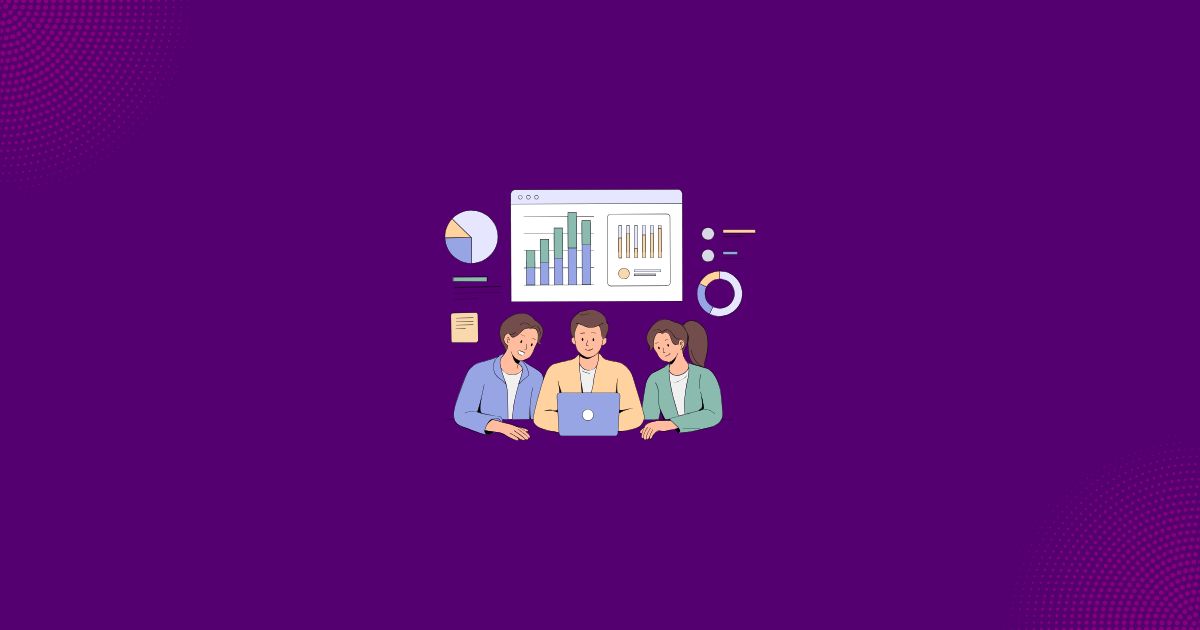
Why Merchants Ignore Their Best Data
The issue is not that these underused Shopify reports are hidden. They are two clicks away. The issue is habit. Merchants built a routine around Google Analytics years ago and never questioned it.
GA became the default "serious" analytics tool. Shopify built-in reports feel like a "basic" dashboard by comparison. That perception is wrong. For product-level decisions, Shopify's first-party data is often more reliable than GA's sampled, script-dependent tracking.
The smartest merchants use both: GA4 for acquisition and traffic analysis, Shopify product reports for product performance and buying behavior. Running a store without checking these three reports is like driving with a GPS but never looking at your fuel gauge.
Set a weekly 15-minute "Shopify Reports" review. Monday mornings. Check Product Segmentation, Purchase Insights, and Cart Insights. That single habit will surface problems faster than any amount of GA4 exploration.
From Reports to Revenue: Connecting the Dots
These three underused Shopify reports tell a story when read together. Product Segmentation shows what is underperforming. Purchase Insights shows how long the decision takes. Cart Insights shows where the drop-off happens.
The combination answers one big question: "Which products need help, how much time do customers need, and where does the cart-to-checkout gap live?"
Acting on Product Segmentation Data
Once you identify Bottleneck and Stopper products through Shopify's segmentation, the next question is what to do with them. Growth Suite's Product Deals feature uses these same segments to automatically rotate targeted discounts on underperforming products. It applies the right discount depth based on each product's performance zone, then reverts prices and cycles to the next product automatically. No manual work required.
Acting on Purchase Insights Data
If your Shopify purchase insights report shows that customers need multiple sessions before buying, timing matters. Growth Suite tracks visitor behavior across sessions and only presents a personalized offer when engagement signals suggest the visitor is close to a decision but likely to leave. Instead of a blanket pop-up on the first visit, the offer appears when the data says it will actually help.
Your Best Analytics Tool Is Already Installed
Google Analytics is excellent for traffic. Shopify built-in reports are better for product and cart decisions. Product Segmentation, Purchase Insights, and Cart Insights are three underused Shopify reports that most merchants never open. Each one answers a question GA4 struggles with.
Fifteen minutes a week with these underused Shopify reports will change how you run your store. You do not need another analytics tool. You need to open the one you already have.
Open your Shopify Analytics tab right now. Find one product in the "Bottleneck" segment. That single discovery might be worth more than your last month of GA4 reports.
For merchants who want to act on these insights automatically, Growth Suite connects directly to Shopify's product performance data to personalize offers, rotate deals on underperforming products, and time discounts based on real visitor behavior - all without leaving the Shopify ecosystem.
Frequently Asked Questions
What Shopify reports are better than Google Analytics?
Shopify's Product Segmentation report, Purchase Insights report, and Cart Insights report all provide first-party data that Google Analytics cannot match. Product Segmentation classifies products by conversion performance. Purchase Insights reveals how many sessions and days customers need before buying. Cart Insights gives server-side cart data unaffected by ad blockers or script failures.
How do I find the Product Segmentation report in Shopify?
Go to your Shopify Admin, click Analytics, then select Product analytics. You will see products organized into segments like Stars, Gems, Bottlenecks, and Stoppers based on their traffic volume and add-to-cart performance relative to your store average.
Why is Shopify cart data more accurate than Google Analytics?
Shopify records cart events server-side. That means every cart creation and product addition is captured regardless of ad blockers, cookie consent banners, or JavaScript loading issues. GA4 relies on client-side event tracking, which can be blocked or fail to fire. This results in undercounted cart data in GA4.
Can I use Google Analytics and Shopify reports together?
Yes, and that is the recommended approach. Use GA4 for traffic acquisition analysis - where visitors come from, which campaigns work, and demographic data. Use Shopify reports for product performance and buying behavior - which products convert, how long purchases take, and what cart patterns look like. The two tools complement each other well.
How often should I check Shopify's built-in reports?
A weekly 15-minute review is a good starting point. Check Product Segmentation for products that need attention, Purchase Insights for changes in buying cycles, and Cart Insights for shifts in cart size and value. Monthly deep dives help you spot longer-term trends.
References
- Google Analytics 4 Documentation - Data Sampling and Thresholds
- Shopify Help Center - Analytics and Reports Overview
- Shopify Help Center - Product Analytics
- Baymard Institute - Cart Abandonment Rate Statistics (2025-2026)
- Blockthrough - Ad Blocker Usage Annual Report
- Littledata - Shopify Analytics Benchmark Studies
- Shopify Commerce Reports - Purchase Behavior Insights
- Dynamic Yield - Cart Abandonment Benchmarks by Industry
Ready to Implement These Strategies?
Start applying these insights to your Shopify store with Growth Suite. It takes less than 60 seconds to launch your first campaign.
Muhammed Tüfekyapan
Founder of Growth Suite
Muhammed Tüfekyapan is a growth marketing expert and the founder of Growth Suite, an AI-powered Shopify app trusted by over 300 stores across 40+ countries. With a career in data-driven e-commerce optimization that began in 2012, he has established himself as a leading authority in the field.
In 2015, Muhammed authored the influential book, "Introduction to Growth Hacking," distilling his early insights into actionable strategies for business growth. His hands-on experience includes consulting for over 100 companies across more than 10 sectors, where he consistently helped brands achieve significant improvements in conversion rates and revenue. This deep understanding of the challenges facing Shopify merchants inspired him to found Growth Suite, a solution dedicated to converting hesitant browsers into buyers through personalized, smart offers. Muhammed's work is driven by a passion for empowering entrepreneurs with the data and tools needed to thrive in the competitive world of e-commerce.
More Insights from Our Blog
Continue reading for more expert tips and strategies to grow your Shopify store

Memorial Day Weekend: Planning a Sale That Protects Your Brand and Margins
Memorial Day sales don't have to destroy your margins. Learn a practical framework for running profitable holiday promotions that protect your brand value.
The Problem with Benchmarking Your Store Against "Industry Averages"
Generic ecommerce benchmarks hide more than they reveal. Learn why comparing your Shopify store to industry averages is flawed and what to measure instead.

How to Build a Summer Marketing Calendar That Doesn't Rely on Constant Sales
Plan your summer marketing calendar around value, content, and strategic moments instead of nonstop discounts. A practical month-by-month framework for Shopify merchants.